
BigQuery Graph Is Now GA, Bringing Native Graph Analytics and AI Agent Grounding to BigQuery
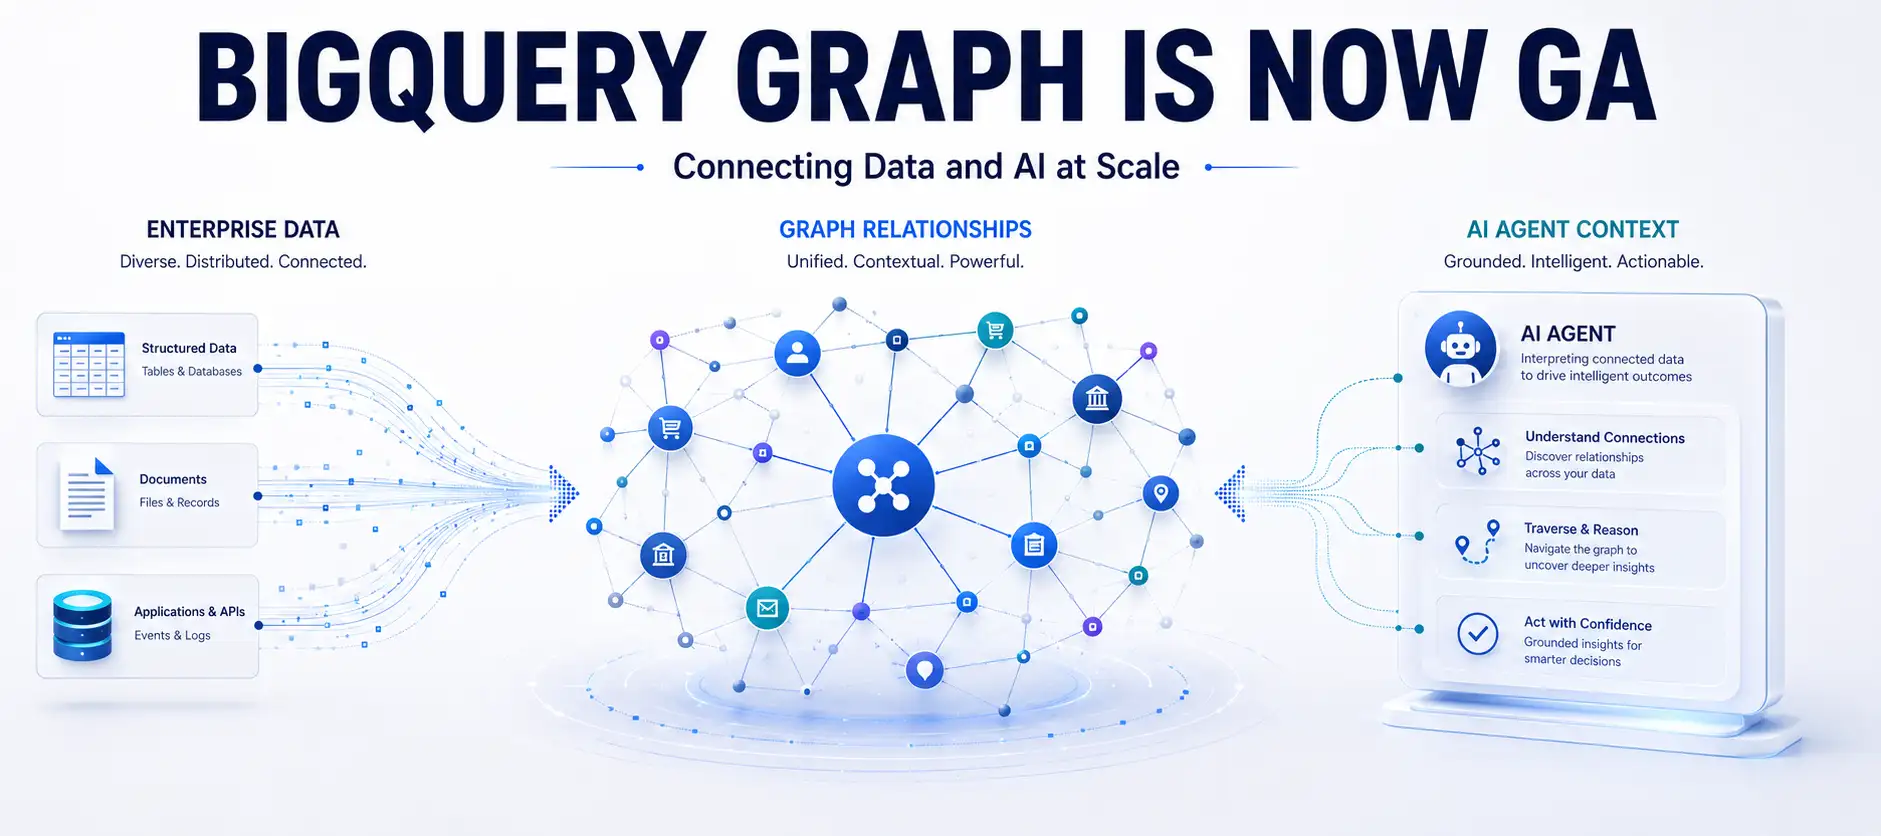
Google Cloud has announced the general availability of BigQuery Graph, bringing native graph analytics, GQL, cross-cloud data traversal, and connected context for AI agents directly into BigQuery.
Xcademia Team
BigQuery Graph Is Now GA, Bringing Native Graph Analytics and AI Agent Grounding to BigQuery
Google Cloud has announced the general availability of BigQuery Graph, bringing native graph capabilities directly into its data warehouse.
The technology is designed for enterprise questions that depend on relationships between data rather than individual rows. Examples include determining how accounts are connected, tracing the path of a payment, identifying relationships between entities, and providing connected context for AI agents.
Google Cloud says BigQuery Graph brings ISO-standard Graph Query Language (GQL) alongside SQL, allowing graph traversals to run natively without extracting data into a separate graph database or building ETL pipelines.
Because BigQuery Graph is built directly on BigQuery, Google says it can operate at petabyte scale, work with existing row- and column-level security, and call BigQuery ML and AI functions within the same query.
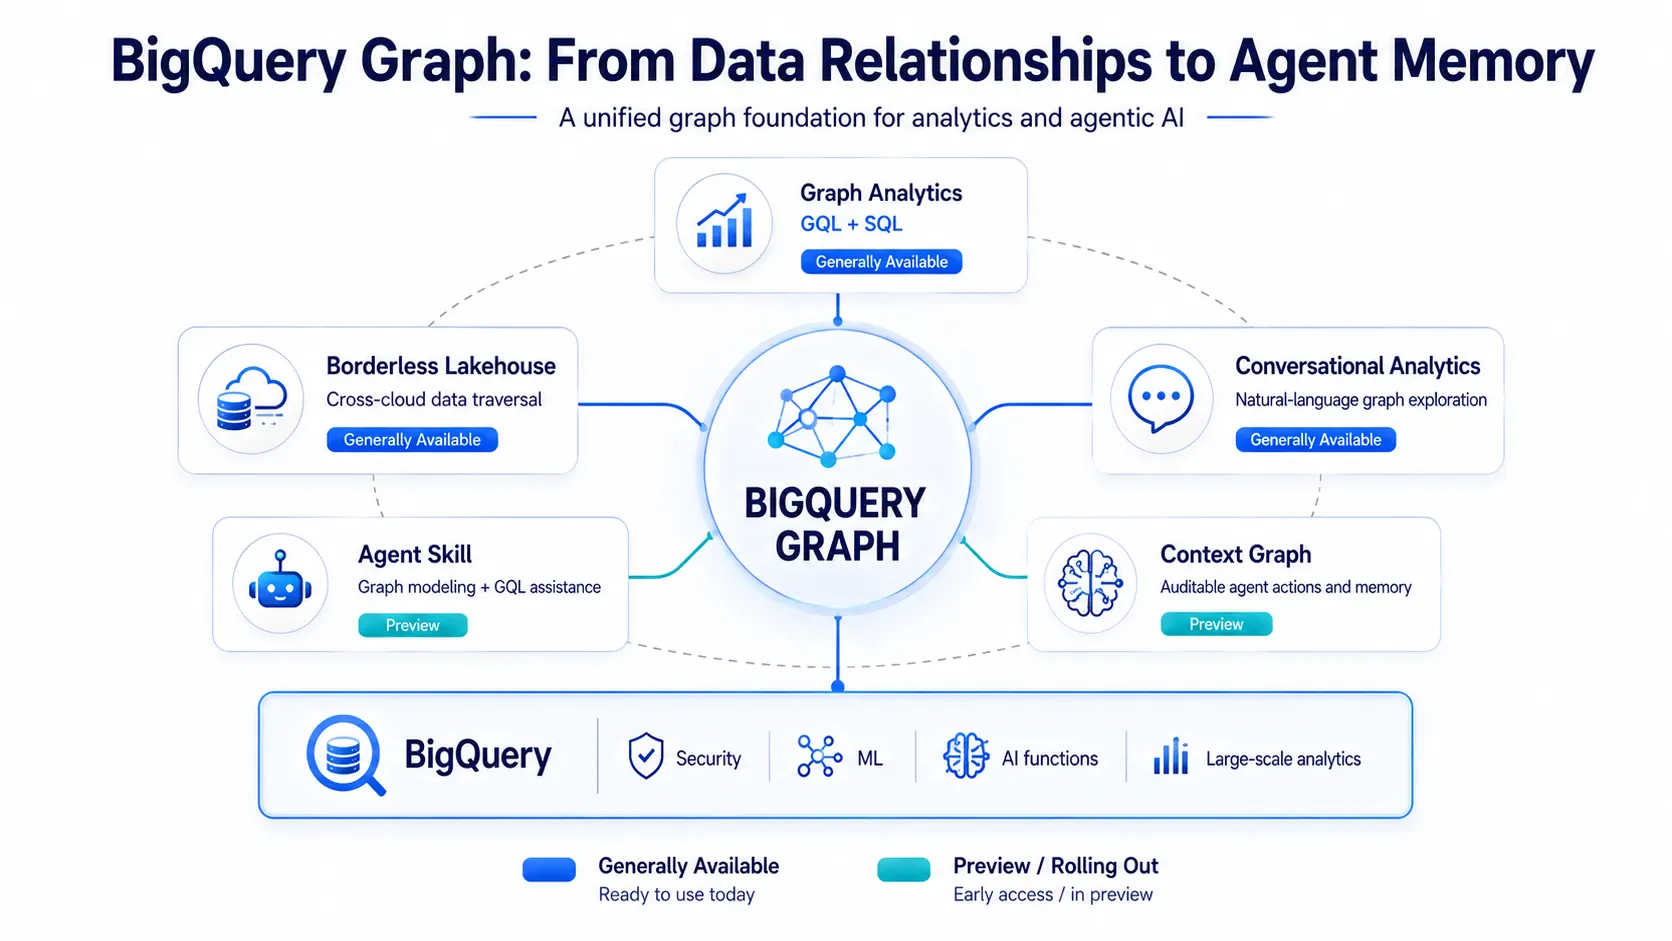
The company describes this as combining two roles in one engine: large-scale graph analytics and connected context for AI agents.
Why Graph Analytics Matters for Enterprise Data
Many enterprise questions are not simply about finding a particular record.
They depend on understanding how records connect.
For example, an organization may need to determine:
How two accounts are connected
What path a payment took
Which entities are connected to a suspicious event
Which supplier is associated with a product
What context should be provided to an AI agent
How infrastructure components depend on one another
These are relationship-focused questions.
Historically, organizations could extract data from a warehouse and move it into a dedicated graph database to perform this type of analysis.
Google Cloud says that approach can create data silos and additional operational overhead.
BigQuery Graph is intended to remove that separation by bringing graph capabilities directly into BigQuery.
BigQuery Graph Reaches General Availability
Google Cloud introduced BigQuery Graph in preview as a way to unify graph and relational analytics.
With the general availability release, GQL sits alongside SQL, and graph traversals run natively within BigQuery.
Google Cloud highlights several capabilities:
ISO-standard Graph Query Language
Native graph traversal
No ETL required for graph analysis within BigQuery
Petabyte-scale graph analytics
Existing row- and column-level security
Integration with BigQuery ML and AI functions
Support for connected AI agent context
The company says the GA release represents more than a stability milestone.
According to Google Cloud, development focused on two areas: making the graph engine faster and broader, and building an agentic ecosystem around it.
Some of the capabilities described in the announcement are generally available, while others are in preview or rolling out over the following weeks.
What Is a Property Graph?
BigQuery Graph uses a property graph model.
In this approach, data can be represented through:
Nodes, representing entities
Edges, representing relationships
Properties, representing information associated with those entities or relationships
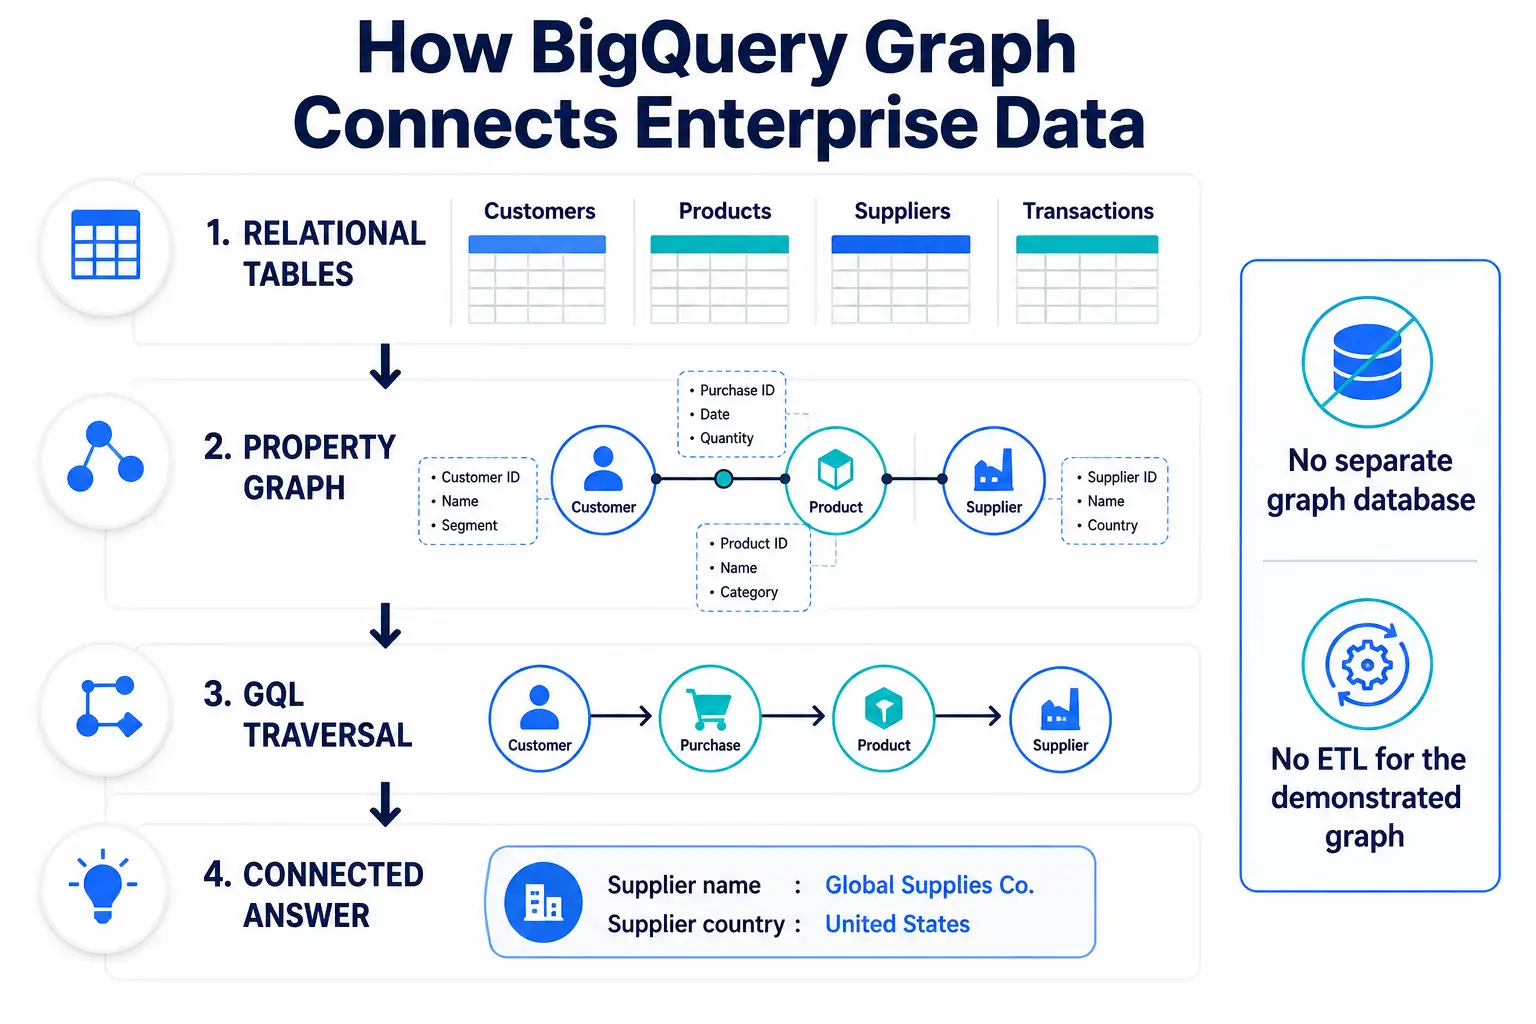
For example, a customer can be represented as a node, a product as another node, and a purchase as an edge connecting the customer to the product.
This structure makes it possible to ask questions that involve multiple relationships or "hops" through the data.
Instead of treating each table independently, graph analysis focuses on the connections between entities.
Cross-Cloud Data With Borderless Graph Lakehouse
One of the capabilities highlighted in the announcement is borderless Lakehouse.
Google Cloud says a single BigQuery Graph can span native BigQuery tables and open Iceberg tables in other clouds through:
Databricks Unity Catalog
AWS Glue
Snowflake
The key point is that the graph can traverse the data in place, without copying the underlying data or building ETL pipelines.
Google Cloud provides a retail example.
Imagine a support agent needs to answer:
Who supplies the product behind this customer's delayed order, and where are they based?
The customer information could be stored in an Iceberg lakehouse on Google Cloud, while product and supplier information could be available through a Databricks catalog on AWS.
Rather than assembling those relationships separately for every request, BigQuery Graph can represent the sources through a virtual knowledge graph.
The Cross-Cloud Graph Definition
Google Cloud provides a DDL example showing how a virtual property graph can map node and edge tables across cloud environments.
The following example is from the Google Cloud announcement:
-- A virtual knowledge graph spanning two clouds - no data movement
CREATE OR REPLACE PROPERTY GRAPH `my_project.retail.virtual_kg`
  NODE TABLES (
    -- Google Cloud
    `my_project.gcs_lake.retail.customers` AS Customer KEY (customer_id),
    -- AWS
    `my_project.dbx_fed_catalog.retail.products` AS Product KEY (product_id),
    `my_project.dbx_fed_catalog.retail.suppliers` AS Supplier KEY (supplier_id)
  )
  EDGE TABLES (
    `my_project.gcs_lake.retail.purchases` AS Bought KEY (purchase_id)
      SOURCE KEY (customer_id) REFERENCES Customer (customer_id)
      DESTINATION KEY (product_id) REFERENCES Product (product_id),
    `my_project.dbx_fed_catalog.retail.products` AS Supplied_By KEY (product_id)
      SOURCE KEY (product_id) REFERENCES Product (product_id)
      DESTINATION KEY (supplier_id) REFERENCES Supplier (supplier_id)
  );
The example defines:
A Customer node table
A Product node table
A Supplier node table
A Bought relationship between customers and products
A Supplied_By relationship between products and suppliers
The graph therefore creates a connected model across data sources.
Using GQL to Traverse the Virtual Knowledge Graph
Once the graph has been defined, Google Cloud demonstrates how an agent can traverse it to answer a multi-hop question.
The example starts with a customer, follows the customer's purchase to a product, then follows the product to its supplier.
-- Agent grounding: trace a customer to the supplier behind their product, across clouds
GRAPH `my_project.retail.virtual_kg`
MATCH (c:Customer {customer_id: 'C1'})-[:Bought]->
      (:Product)-[:Supplied_By]->(s:Supplier)
RETURN s.name AS supplier, s.country AS supplier_country
The query demonstrates the basic value of graph traversal.
The system does not need to treat the customer, product and supplier as unrelated datasets. Their relationships are explicitly represented in the graph.
The result can therefore trace a path across multiple entities and data environments.
Faster and More Expressive GQL
Google Cloud says BigQuery Graph has also received improvements to graph query execution and expressiveness at GA.
The company reports that, against public benchmarks:
GQL is 2x faster since preview
Undirected traversal is 100x faster since preview
Google Cloud also says cycle detection in ACYCLIC and TRAIL path modes is faster and more resource-efficient.
These performance figures are Google's reported results against public benchmarks and should not be interpreted as a universal performance guarantee for every workload.
The announcement also introduces a new CALL statement and extended subquery support.
These capabilities allow users to run graph subqueries for individual entities or invoke reusable named functions.
Google Cloud says this can break complex graph questions into smaller components.
The same functions created by analysts can also become building blocks that an agent can call as a tool.
BigQuery Graph for Threat and Fraud Detection
Google Cloud says organizations have adopted BigQuery Graph for several analytical and agentic workflows.
One area is threat and fraud detection.
Security and financial organizations can correlate signals across event logs to identify:
Multi-hop attack paths
Fraud networks
Suspicious transaction loops
The source includes a customer example from Thales Cybersecurity Products.
Pete Rubio, VP of Global Engineering at Thales Cybersecurity Products, said the company uses BigQuery Graph to model security signal data as a property graph and perform multi-hop traversals.
The source says this approach helped the organization cluster anomalies into attack stories and combine graph analysis with Gemini models to generate threat narratives.
Google Cloud also includes a statement from Yahoo describing the use of BigQuery Graph to give AI agents connected context around campaigns, audiences, exposures and outcomes.
These are company-provided examples included in the Google Cloud announcement.
Other BigQuery Graph Use Cases
Google Cloud highlights several other areas where graph-based analysis can be applied.
Supply Chain Digital Twins
Manufacturing and logistics organizations can map relationships across:
Suppliers
Parts
Distribution routes
This can support simulations of disruptions and analysis of fulfillment dependencies.
Identity Resolution and Customer 360
Ad-tech and retail organizations can connect fragmented identifiers and behavioral touchpoints to create unified customer profiles across channels.
Knowledge Graphs and AI Agent Grounding
Enterprise AI teams can build structured knowledge graphs from unstructured documents.
Google Cloud says these graphs can provide domain context for Gemini models and GraphRAG workflows.
Network Lineage and Infrastructure Management
Telecommunications and enterprise IT teams can model:
Network topologies
Service dependencies
Data lineage
Multi-hop infrastructure relationships
The common theme across these examples is the need to understand relationships rather than simply retrieve individual records.
Building Connected Context for AI Agents
Google Cloud positions BigQuery Graph as more than a graph analytics system.
The company says it is also designed to support the agentic era by providing AI systems with connected context.
The reasoning is straightforward.
An AI agent may need to understand relationships between entities before it can produce a useful answer.
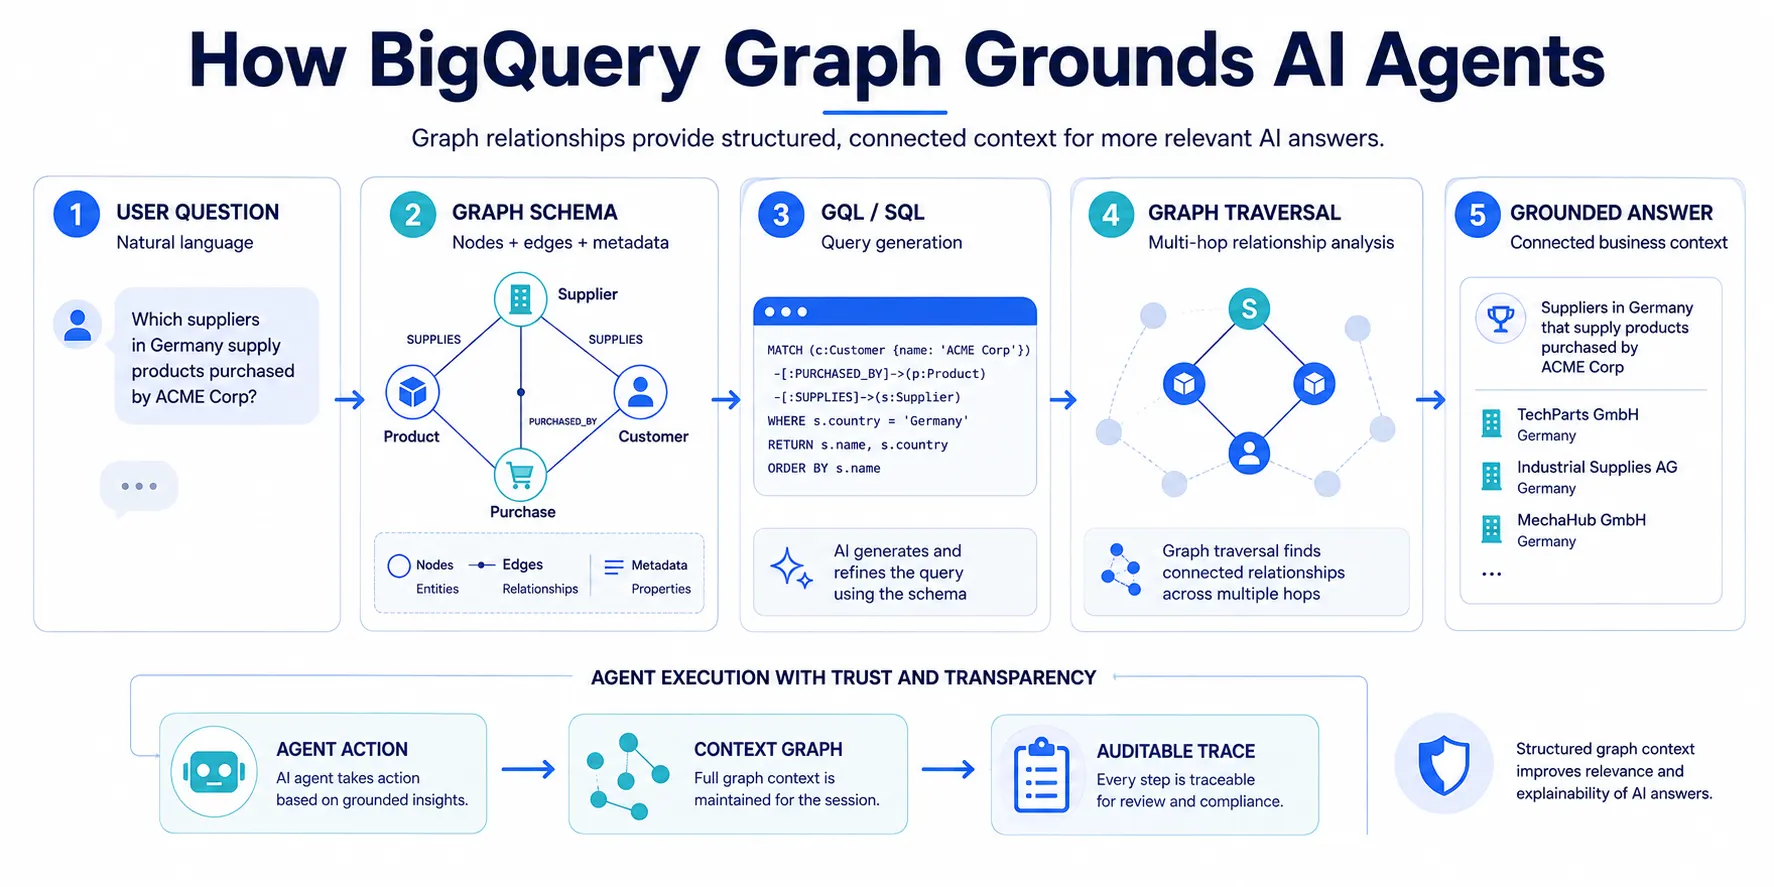
A graph makes those relationships explicit.
Instead of relying solely on free-form natural language interpretation, the agent can use the graph's nodes, edges and metadata to navigate structured relationships.
Chat With Graphs Using Natural Language
Google Cloud says users do not necessarily need to write GQL manually to explore their graphs.
BigQuery conversational analytics can allow users to interact with a graph using natural language.
According to the announcement, the system can:
Read relationships defined in the graph schema
Translate questions into SQL or GQL
Visualize traversals for path-based answers
The agent can also use graph metadata such as descriptions and synonyms.
Google Cloud says these relationships can help reduce ambiguity in natural-language querying.
The company also says users can connect Gemini Enterprise to BigQuery Graph through an MCP server or publish the conversational data agent directly to it.
Agents Can Help Build the Graph
Google Cloud is also introducing an agent skill focused on BigQuery Graph.
The company says this skill gives an agent expertise in:
GQL pattern matching
Combining graph and SQL
Graph schema design
Recommended graph modeling practices
The capability is available through agentic coding tools including:
Antigravity
Visual Studio Code
Claude Code
Codex
Google Cloud says these capabilities are available through the Google Cloud Data Agent Kit extension.
The announcement also describes a graph-authoring capability that is rolling out soon.
According to Google Cloud, this capability can take a dataset, model document or ER diagram and propose nodes and edges.
It can then verify relationships against the underlying data and show match rates for those relationships.
This distinction is important: the announcement describes the graph-authoring capability as rolling out soon rather than presenting it as fully generally available today.
Giving AI Agents an Auditable Memory
Another capability described in the announcement focuses on agent memory and auditability.
Google Cloud says BigQuery Agent Analytics can capture an agent's actions and shape them into a context graph.
The context graph is described as a typed, queryable trace of an agent's reasoning stored in BigQuery Graph.
This creates a graph representation of what an agent did.
Google Cloud explains that because the trace itself is represented as a graph, questions such as:
"Why did the agent do this?"
can be approached through graph traversal.
Outcomes can also be joined back to decisions, allowing those results to become data that can inform subsequent agent behavior.
The announcement presents this as a way to provide connected, auditable memory for autonomous agents.
Auditable Agent Actions Through Context Graphs
The context graph concept extends graph analytics into the operational side of AI agents.
An agent does not only need information to make a decision.
In many workflows, organizations also need to understand what happened afterward.
Google Cloud's approach captures agent actions as structured graph data.
This can make it possible to trace relationships among:
Agent actions
Decisions
Policies
Alternatives
Outcomes
The source positions this as a foundation for explaining agent behavior after the fact.
BigQuery Graph and Security Controls
Because BigQuery Graph is built on BigQuery, Google Cloud says it operates under existing row- and column-level security.
This is important for organizations that already use BigQuery security controls.
Google Cloud says BigQuery Graph runs under existing row- and column-level security.
Instead, the stated advantage is that graph workloads can operate within the security model of the underlying BigQuery environment.
BigQuery Graph Brings Graph and Relational Analytics Together
A key theme in Google's announcement is convergence.
Organizations often have relational data already stored in analytical warehouses.
At the same time, some questions require graph-style analysis.
BigQuery Graph is designed to allow both approaches to operate within the same environment.
That means teams can use:
SQL for relational analysis
and
GQL for graph traversal
while also calling BigQuery ML and AI functions in the same query environment.
Google Cloud describes this as one engine serving two related purposes:
Large-scale graph analytics + connected context for AI agents.
What Is New at General Availability?
Google Cloud's announcement highlights several areas of development around the GA release.
Capability | Status or description |
|---|---|
BigQuery Graph | Generally available |
ISO-standard GQL | Available with BigQuery Graph |
Native graph traversal | Available |
Graph and relational analytics | Unified in BigQuery |
Petabyte-scale graph analytics | Supported by BigQuery architecture |
Row- and column-level security | Inherited from BigQuery |
BigQuery ML and AI functions | Can be called in the same query |
Borderless Lakehouse | Described in the announcement |
Cross-cloud Iceberg traversal | Supported through specified catalogs |
Conversational graph analytics | Described as available |
Gemini Enterprise connection | Through MCP server or conversational data agent |
Graph agent skill | Available through Google Cloud Data Agent Kit extension |
Graph-authoring capability | Rolling out soon |
Context graph for agent memory | Part of BigQuery Agent Analytics |
Some capabilities are available today, while others are in preview or rolling out, as specified by Google Cloud.
Where BigQuery Graph Could Be Used
Google Cloud provides several starting points for teams exploring BigQuery Graph.
The company specifically points to:
Fraud Detection
Organizations can use graph relationships to investigate suspicious money movement and synthetic identities.
Identity Resolution
Teams can connect fragmented emails, devices and cookies into a unified customer identity.
Supply Chain Modeling
Organizations can model supply chains as digital twins and query dependencies when disruptions occur.
Agent Context Graphs
Teams can transform raw event logs into graphs that trace and explain autonomous agent activity.
Google Cloud also points to a unified graph solution combining Spanner Graph and BigQuery Graph for workloads involving both real-time operational transactions and large-scale analytics.
Why the GA Release Matters
The general availability of BigQuery Graph represents Google's effort to make graph analytics a native component of enterprise data infrastructure rather than a separate analytical silo.
The announcement also reflects the growing connection between graph technology and AI agents.
Traditional analytics can answer questions about records.
Graph analytics can answer questions about relationships.
AI agents often need both.
By combining relational data, graph traversal, AI functions and agent-oriented capabilities within the BigQuery environment, Google Cloud is positioning BigQuery Graph as a foundation for applications where connected context matters.
The announcement highlights a broader industry shift toward building AI systems around structured enterprise context, rather than relying exclusively on unstructured retrieval or standalone AI models.
For enterprises, this could mean greater emphasis on how data relationships are modeled and made available to AI systems.
Conclusion
Google Cloud has announced the general availability of BigQuery Graph, bringing native graph analytics and connected AI agent context into the BigQuery environment.
The platform combines SQL and ISO-standard GQL, allowing organizations to work with relational and graph-based analysis without moving graph workloads into a separate database.
Google Cloud says BigQuery Graph can operate at petabyte scale, use existing BigQuery row- and column-level security, and call BigQuery ML and AI functions within the same query environment.
The announcement also expands the platform beyond traditional graph analytics.
With borderless Lakehouse, Google Cloud says a graph can span native BigQuery tables and open Iceberg tables across supported cloud catalogs without copying the underlying data. Conversational analytics allows users to explore graphs using natural language, while an agent skill can help with graph modeling and GQL.
The company is also developing an agent-oriented layer around the technology.
Through BigQuery Agent Analytics, agent activity can be represented as a context graph, creating a queryable trace of actions and decisions.
For enterprises, the broader significance is the convergence of data relationships, analytics and AI agents.
As AI systems become more dependent on enterprise context, understanding how data entities connect can become as important as retrieving individual records.
BigQuery Graph is Google's latest effort to make those relationships directly usable within the data warehouse and within AI-driven workflows.
Source: Google Cloud Blog
About the Author