
Google GKE Adds Native Prometheus Metrics Support for Smarter HPA Autoscaling
Google Cloud has introduced built-in Prometheus metrics support for GKE Horizontal Pod Autoscaler, allowing workloads to scale using PromQL without third-party adapters.
Xcademia Team
Xcademia Research Team
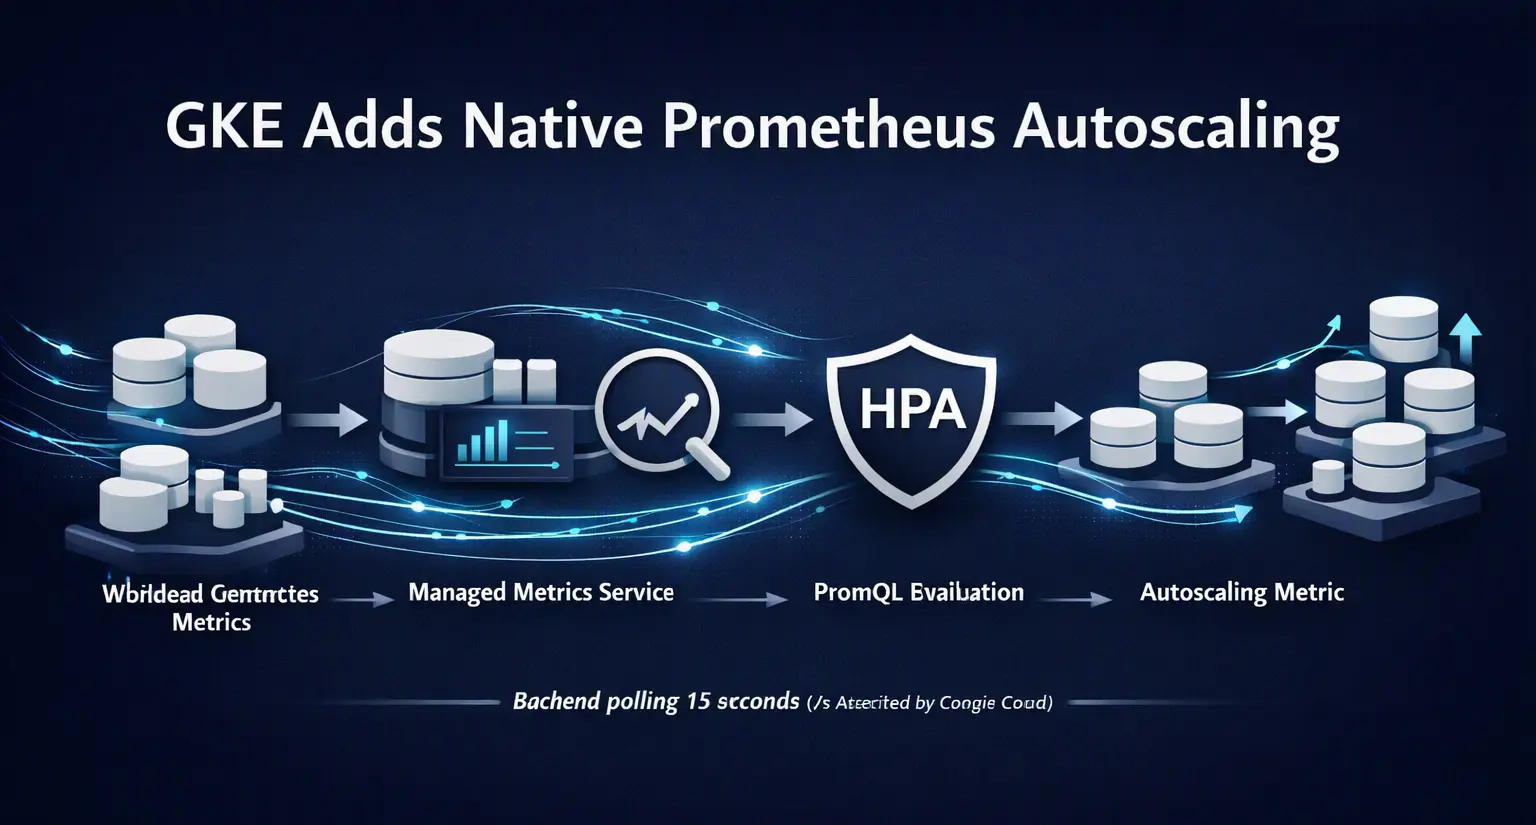
Google GKE Brings Prometheus Metrics Directly Into HPA Autoscaling
Google Cloud has introduced built-in support for Prometheus metrics in Google Kubernetes Engine (GKE), giving Kubernetes workloads a way to use PromQL queries directly when determining Horizontal Pod Autoscaler (HPA) scaling decisions.
The feature, announced on September 23, 2026, is currently available in preview. It allows HPA to process autoscaling metrics available through Cloud Monitoring and Google Managed Service for Prometheus without requiring a separate Prometheus adapter.
The announcement builds on Google's earlier introduction of native custom metrics support for GKE, which was designed to reduce the infrastructure required to connect workload metrics with HPA.
For teams running Kubernetes workloads, the change focuses on one specific problem: making application and infrastructure metrics easier to use as signals for automatic scaling.
Why Kubernetes Autoscaling Often Needs More Than CPU and Memory
Kubernetes HPA commonly scales workloads according to resource measurements such as CPU and memory.
Those signals are useful, but they do not always describe what is actually driving demand.
For example, a workload might need to scale according to:
The number of unacknowledged messages in a Pub/Sub subscription
Requests per second handled by an inference service
Response-time percentiles
Application-specific Prometheus metrics
Metrics calculated over a time window
Google Cloud's announcement specifically describes scenarios involving queue depth, QPS and the 95th percentile of measured response time.
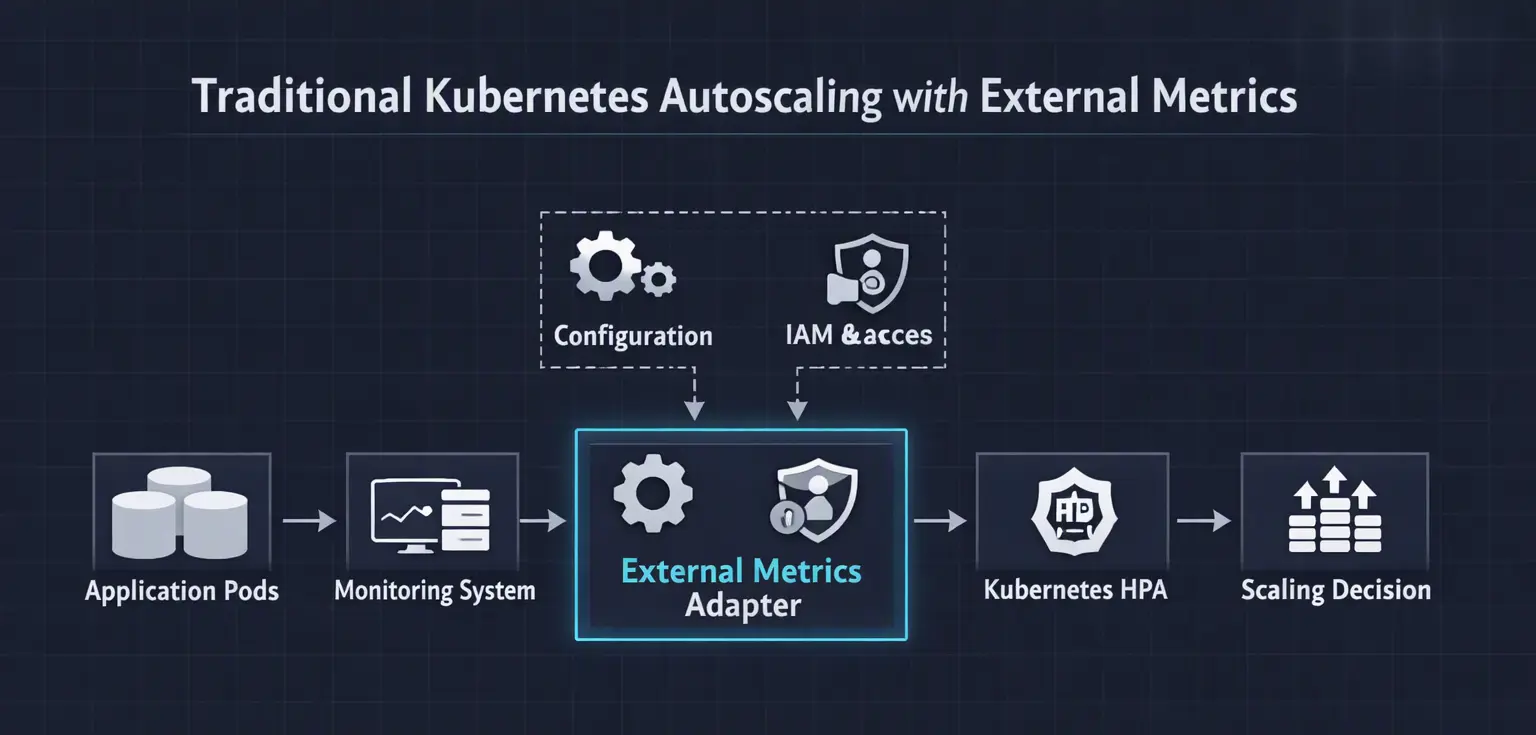
The challenge has traditionally been connecting these external or custom metrics to HPA.
Teams could use components such as the Prometheus adapter or the Stackdriver Custom Metrics Adapter. Google says these approaches add management overhead, intermediate components and additional IAM configuration.
What Google Cloud Is Changing
With the new capability, GKE's AutoscalingMetric resource can define PromQL-based metrics that HPA can use for scaling.
Instead of relying on a separate adapter to retrieve the metrics, the metrics can be processed through GKE's autoscaling infrastructure.
The basic flow becomes:
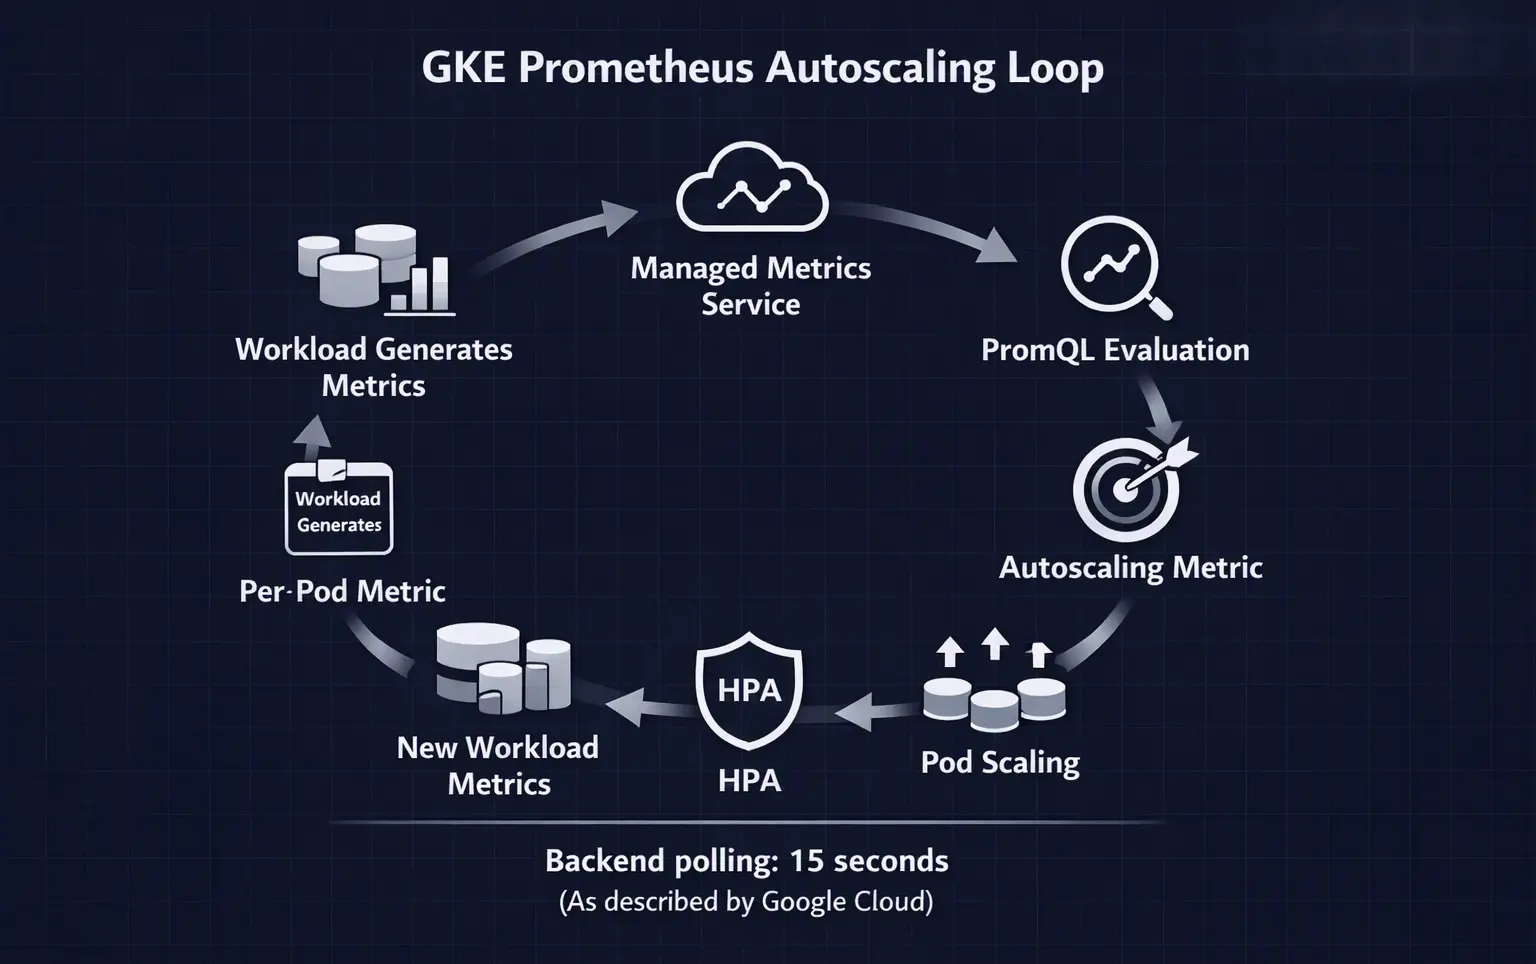
Prometheus metric → PromQL query → AutoscalingMetric → HPA → Scaling action
Google says the controller runs on the GKE control plane. A system pod is deployed on user nodes only when a PromQL metric is actively requested. If no Prometheus metrics are configured, the system pod is shut down.
This architecture is intended to reduce the number of components platform teams need to operate.
How PromQL Fits Into GKE Autoscaling
PromQL is the query language used with Prometheus.
Its importance in this update is that scaling decisions are no longer limited to simply reading one raw metric value.
PromQL can perform operations such as:
Calculating rates
Computing averages
Working across time windows
Calculating histogram percentiles
Aggregating metrics across workloads
Google gives an example using a five-minute rolling window to calculate average per-pod memory usage.
This makes the scaling signal more flexible.
For example, instead of saying:
Scale when memory reaches a particular value.
A workload can use a PromQL expression that calculates an aggregated or time-based signal and then provide that result to HPA.
Example: Scaling a Worker From Queue Depth
One example in Google's announcement uses the number of undelivered Pub/Sub messages as a scaling signal.
The AutoscalingMetric configuration defines a PromQL metric:
apiVersion: autoscaling.gke.io/v1beta1
kind: AutoscalingMetric
metadata:
  name: gmp-metric
spec:
  metrics:
    - promql:
        name: pubsub-queue-depth
        query: |
          {
            "pubsub.googleapis.com/subscription/num_undelivered_messages",
            subscription_id="my-subscription"
          }
The resulting metric can then be referenced from a standard Kubernetes HorizontalPodAutoscaler.
Google's example uses:
autoscaling.gke.io|gmp-metric|pubsub-queue-depthas the metric name referenced by HPA.
The important concept is that the queue becomes a direct scaling signal.
If the queue grows, HPA can use that metric to determine whether additional worker capacity is required.
Global Metrics and Per-Pod Metrics
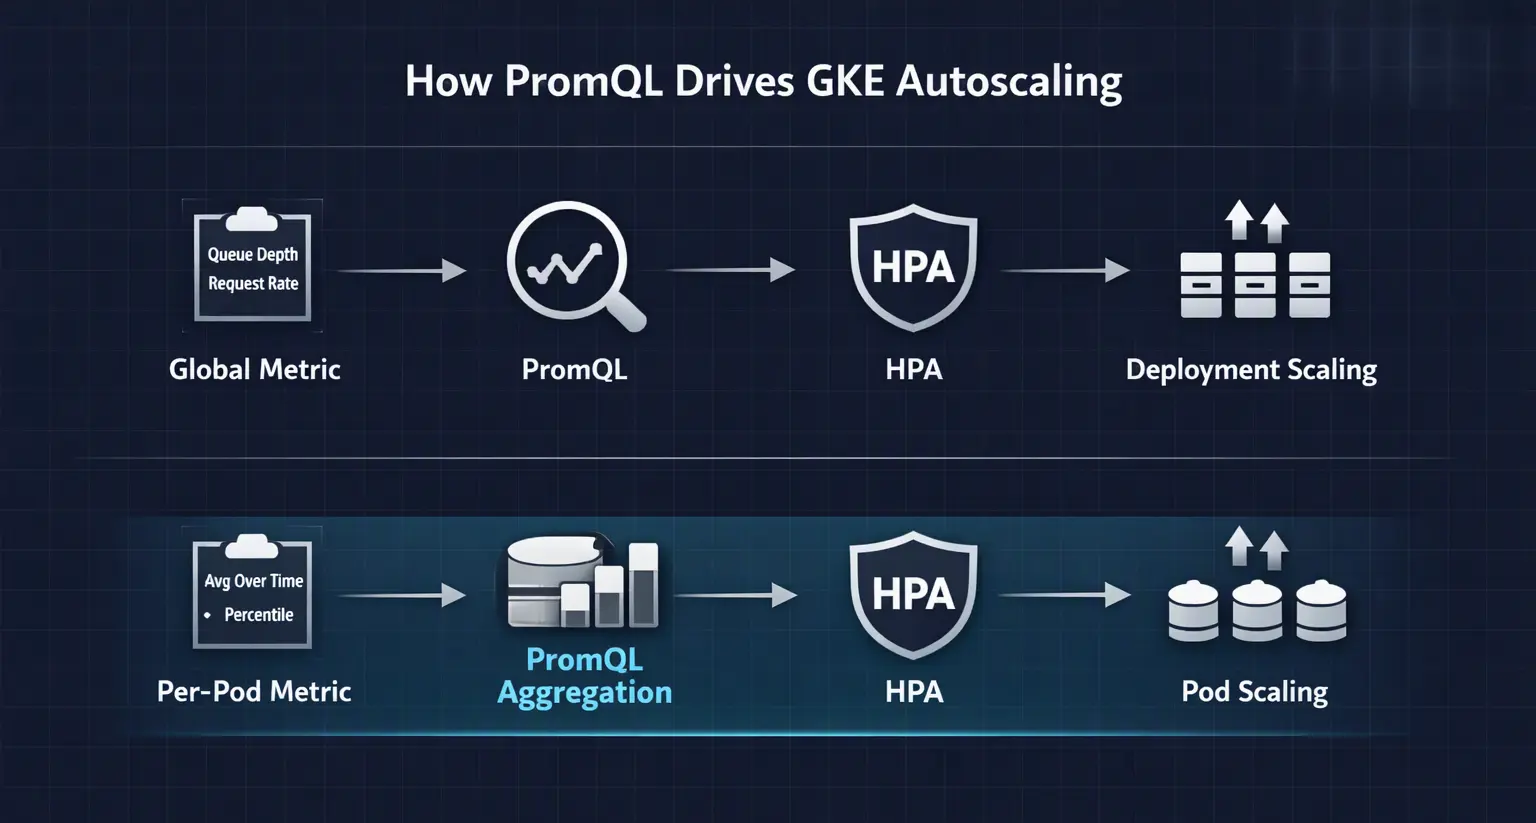
Google describes two ways the Prometheus-based metrics can be used.
Global metrics
A global metric produces a single aggregate value.
Queue size is an example.
A worker deployment could use the total queue size as an external metric and maintain a target queue depth per pod. Google's example sets the HPA target to an average value of 100.
Per-pod metrics
PromQL can also return metrics associated with individual pods.
Google's example calculates average container memory usage over a five-minute period and groups the result by pod:
sum by ("pod") (
  avg_over_time({"container_memory_working_set_bytes"}[5m])
)
The resulting metric is configured with:
type: PodsThis allows HPA to use the PromQL result as a per-pod scaling signal.
What Happens to Third-Party Adapters?
One of the main changes is that teams using the new GKE capability do not need to install, configure, patch or upgrade a separate metrics adapter for this workflow.
Google describes this as a reduction in operational overhead because the lifecycle of the relevant autoscaling infrastructure is managed within GKE.
The announcement also points to a simplified IAM model.
According to Google, the Kubernetes Default Node Service Agent has read permissions to Cloud Monitoring and Google Managed Service for Prometheus within the same project. Google says this removes the need for additional IAM service accounts, keys or federation parameters for this scenario.
That does not mean Kubernetes observability becomes configuration-free. Teams still need to define the metrics they collect, configure their workloads and establish appropriate autoscaling policies.
The change is specifically focused on simplifying the connection between Prometheus metrics and GKE autoscaling.
Polling and Scaling Response
Google says the new Autoscaling Metric system polls the backend every 15 seconds. The company describes this as supporting fast scaling reactions.
This is different from the earlier native custom metrics announcement, where Google described a five-second metrics reading latency for metrics sourced directly from pods. The two figures refer to different parts of GKE's native metrics and autoscaling capabilities, so they should not be treated as interchangeable performance measurements.
GKE and the Google Managed Service for Prometheus
The new feature works with Prometheus metrics available through Google Managed Service for Prometheus.
Google describes its managed Prometheus service as a fully managed way to monitor and alert on workloads using Prometheus without manually operating Prometheus at scale.
GKE can also collect different categories of observability metrics, including system metrics, control plane metrics and Kubernetes state metrics. Google Cloud documentation also describes support for third-party and user-defined metrics through Prometheus exporters.
The new autoscaling functionality adds another use for those metrics: they can become inputs to HPA decisions.
This creates a closer connection between observability data and workload capacity management.
Support for Scale-to-Zero
Google also highlights compatibility with the newer HPA scale-to-zero capability.
For workloads where demand can reach zero, this can allow workloads to scale down to zero replicas when there is no active demand.
Google gives Pub/Sub queue size as an example. The announcement also mentions using the CapacityBuffers API to help workloads recover quickly from zero replicas.
The practical value depends on the workload architecture and the metric being used to determine demand.
What Is Available Today?
The Prometheus metrics support described in the announcement is currently in preview.
Google says that after the preview, it plans to support self-hosted Prometheus servers as the feature moves toward general availability.
That distinction is important for organizations that operate their own Prometheus infrastructure rather than using Google Managed Service for Prometheus.
At the time of the announcement, the documented integration is focused on metrics available through Cloud Monitoring and Google Managed Service for Prometheus.
Additional details about the future self-hosted Prometheus integration were not disclosed in the announcement.
What This Means for Kubernetes Teams
The announcement highlights a broader industry shift toward making autoscaling decisions based on application-level signals rather than only infrastructure resources.
CPU and memory remain useful signals, but they may not always represent actual workload demand.
For example:
A background worker may need more capacity because a queue is growing.
An API may need more replicas as request rates increase.
An inference service may need scaling based on traffic.
A latency-sensitive service may need to react to response-time measurements.
PromQL provides a way to transform raw observability data into more meaningful scaling signals.
For platform engineering teams, the main change is architectural simplification. Instead of maintaining a separate adapter between Prometheus and HPA, GKE can now process supported Prometheus metrics as part of its native autoscaling workflow.
The company did not provide specific information about how the preview will perform across different workload sizes or configurations.
The Bigger Picture
GKE's Prometheus integration is part of Google's broader effort to make Kubernetes autoscaling more closely connected to workload intent.
The March 2026 introduction of native custom metrics support established the foundation for using workload-specific signals without the traditional adapter architecture. The September update extends that model to PromQL-based Prometheus metrics.
For organizations already using Google Managed Service for Prometheus, this creates a more direct path from monitoring data to automated capacity decisions.
For Kubernetes users, the key takeaway is straightforward:
Prometheus metrics are becoming a more direct input into GKE's native autoscaling workflow.
The feature is currently in preview, while broader support, including self-hosted Prometheus, is planned for a later stage.
Source: Google Cloud Blog
About the Author