
Cloudflare Unifies Logs, Traces, SQL, Alerts and Analytics in New Observability Platform
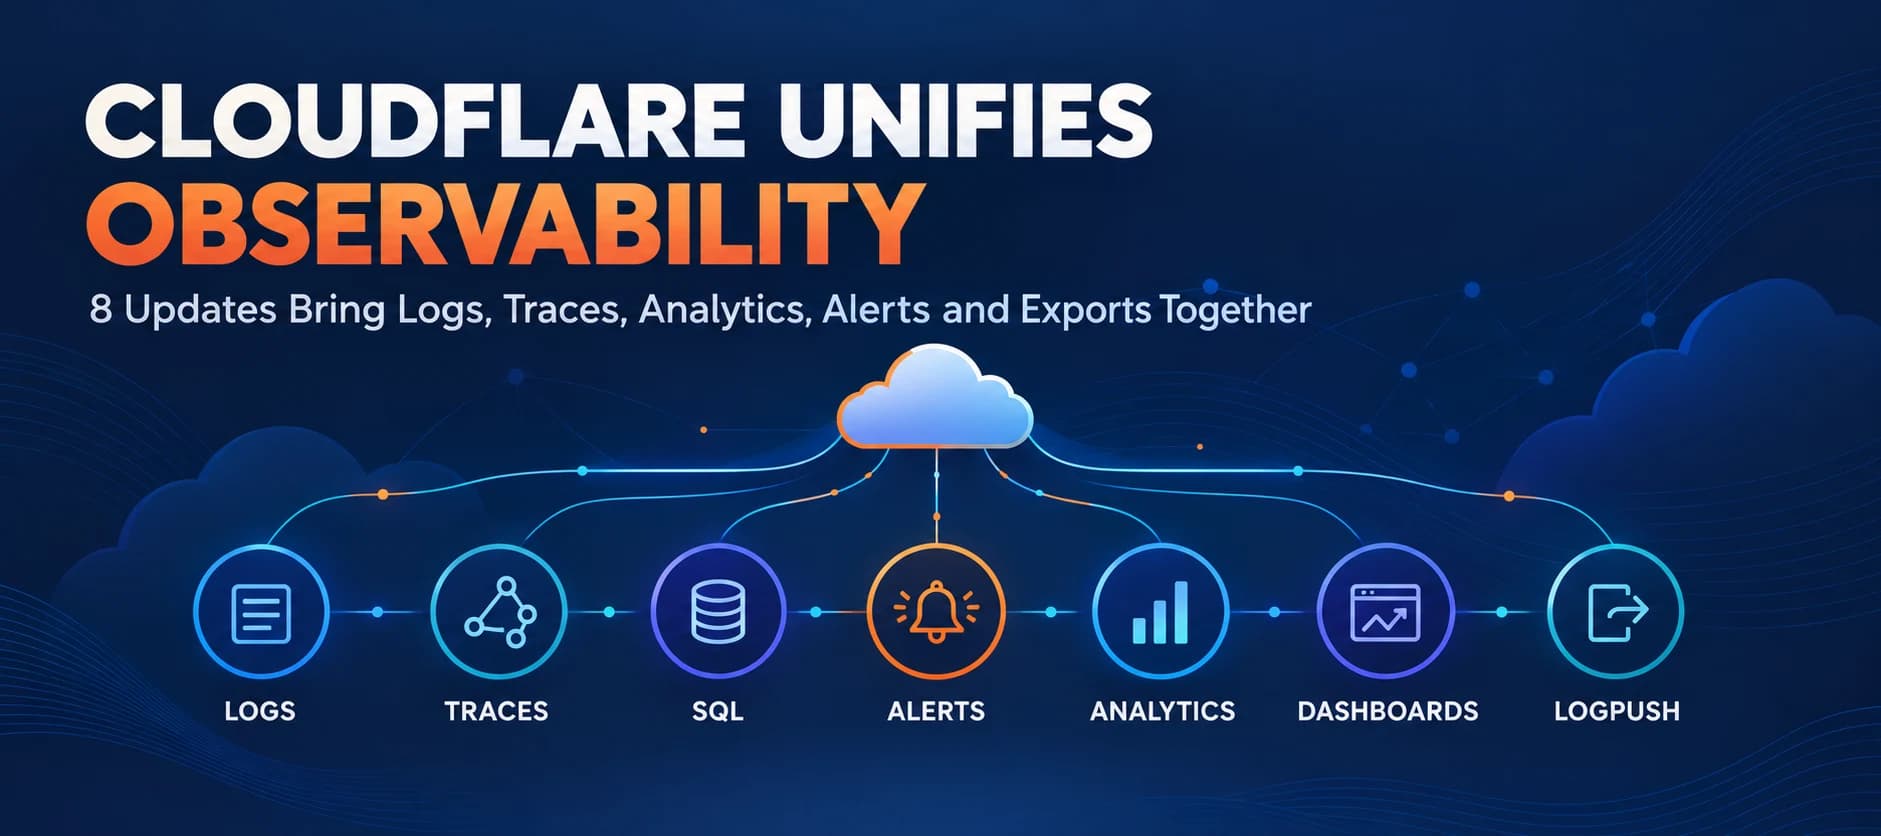
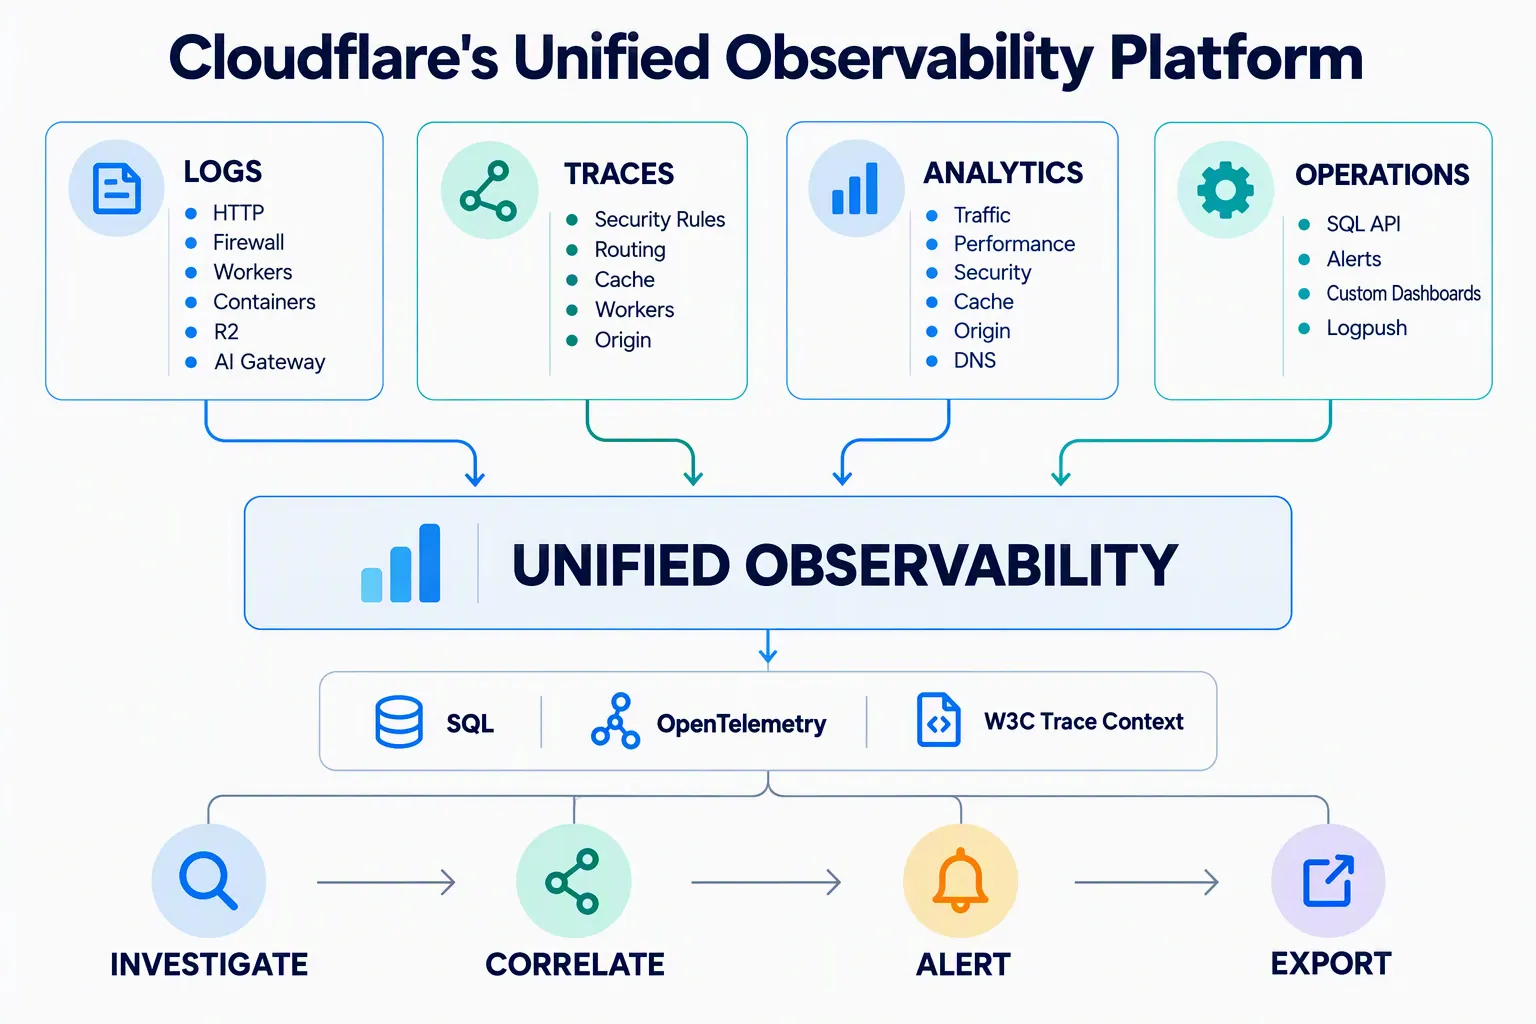
Cloudflare has announced eight observability updates that bring logs, traces, analytics, alerts, dashboards, SQL querying and data exports into a more unified platform, alongside changes to observability pricing.
Xcademia Team
Cloudflare expands its observability platform
Cloudflare has announced eight major updates designed to bring more of its observability capabilities into one platform.
The company says the updated experience brings together logs, traces, analytics, alerts, dashboards and data exporting, while introducing a more unified pricing model for observability data.
The announcement is centered on a common problem in distributed applications: understanding an incident can require information from several Cloudflare products.
For example, an increase in 5xx responses could originate from a Worker, an origin server, or connectivity issues between Cloudflare and the origin. Cloudflare says its goal is to make observability a platform-wide capability so teams can investigate these signals in a more connected way.
The eight updates cover log investigation, request tracing, SQL access, pricing, custom alerts, domain analytics, dashboards and Logpush availability.
Cloudflare also says more products, datasets and workflows will become part of the shared observability platform over the coming months.
The eight updates at a glance
A new place to investigate logs across Cloudflare
Cloudflare Traces in open beta
A unified SQL API for observability data
A new pricing model for ingested and stored logs and traces
Custom alerts in beta
30 days of domain analytics on every plan
Custom dashboards
Logpush availability on all self-serve plans
1. Logs from across Cloudflare in one place
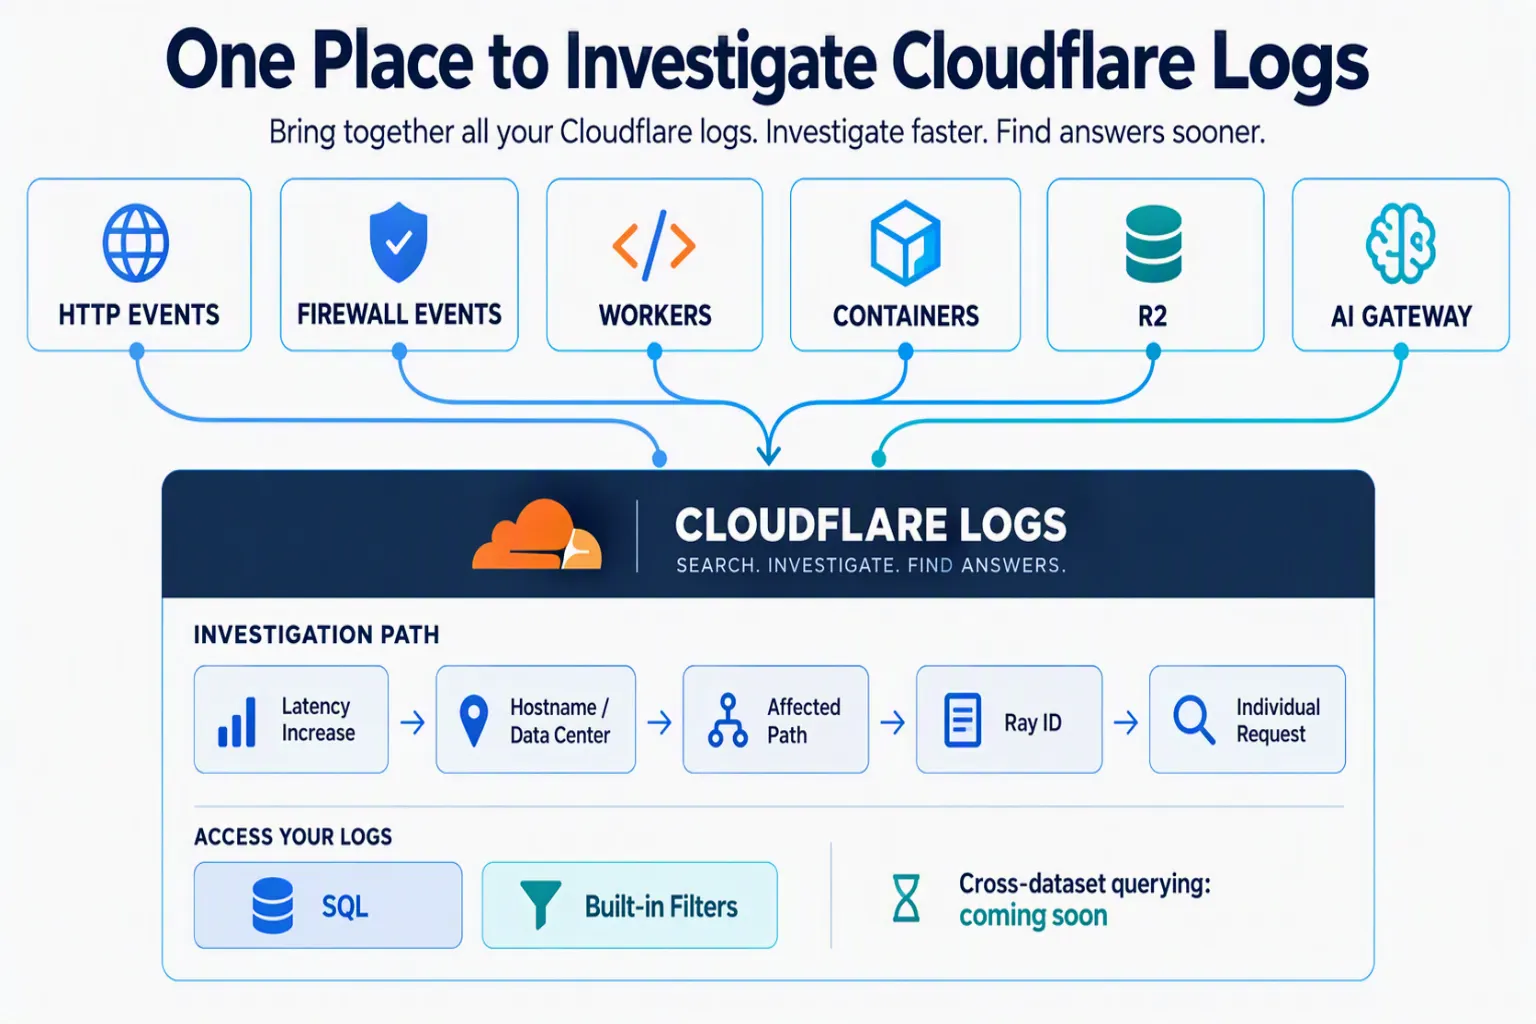
Cloudflare's new Logs home combines Workers Observability with Log Explorer.
The company says users can now work with datasets including:
HTTP events
Firewall events
Workers
Containers
R2
AI Gateway
The same investigative tools can be used across these datasets.
A troubleshooting workflow can begin with increased request latency, for example, and then narrow results by hostname or data center before examining affected paths and individual requests using a Ray ID.
Cloudflare says users can also move between datasets during an investigation without leaving Logs.
Support for querying across multiple datasets is planned for a future update.
The Logs experience supports both raw SQL and built-in filters. Cloudflare also says users can create visualizations using natural language and investigate detected anomalies.
2. Cloudflare Traces enters open beta
Cloudflare is also launching Cloudflare Traces in open beta.
The tracing capability provides a request-level view of supported parts of Cloudflare's platform, including:
Security rules
Transformations
Cache decisions
Routing
Workers
Origin handling
The purpose is to show how traffic moves through Cloudflare and how configuration decisions affect request processing and routing.
Users can establish a baseline sampling rate for continuous visibility. During an investigation, Trace Rules can capture selected traffic at a higher rate.
Cloudflare says traces can be targeted using hostnames, paths, IP addresses or headers. Users can also search by Ray ID and inspect spans in the Cloudflare dashboard.
The tracing system supports exporting through OpenTelemetry and accepting or passing trace context through W3C Trace Context.
This provides a standards-based path for connecting Cloudflare tracing with other parts of an observability stack.
3. A unified SQL API for observability data
Cloudflare is introducing a unified SQL API, currently in beta, for querying telemetry across its platform.
The company says the API is designed to give people and agents a consistent way to investigate observability data, correlate signals and verify fixes.
Instead of maintaining separate integrations for different datasets, users can query supported Cloudflare data through one SQL dialect, authentication model and API.
The unified SQL API can also be accessed through Cloudflare's CLI, cf, or through Cloudflare's Observability MCP server.
Cloudflare says dataset schemas, fields and example queries are available to help users and agents construct queries.
SQL comes directly to Workers
Cloudflare is also bringing the SQL interface directly into Workers through a native binding.
According to the company, Workers can use the interface for tasks such as:
Querying Analytics Engine data
Metering customer usage
Supporting billing workflows
Building customer-facing analytics dashboards
Generating health reports
Automating incident investigations
This connects application logic with Cloudflare observability data without requiring a separate API client for these use cases.
4. Cloudflare introduces unified pricing for logs and traces
One of the most significant operational changes in the announcement is a new pricing model for observability data.
Beginning December 1, 2026, Cloudflare says logs and traces ingested and stored on its platform will move to one unified Observability subscription and pricing model.
For Enterprise customers, the change becomes effective upon renewal.
The new model is based on the volume of data ingested and stored, rather than an event-based count.
Cloudflare provided the following pricing structure:
Plan | Included usage | Retention | Additional usage |
|---|---|---|---|
Free | 0.5 GB ingestion per day | 7 days | Not available |
Paid and Enterprise | 50 GB ingestion and 10 GB-month storage per billing cycle | Up to 1 year, coming soon | $0.25 per GB ingested; $0.10 per GB-month stored |
The company says the model covers existing Developer Platform logs, including Workers, Containers and AI Gateway, as well as tracing data.
For organizations already ingesting or storing observability data through Cloudflare, the pricing change will therefore be an important part of evaluating the new platform.
5. Custom alerts move into beta
Cloudflare is also upgrading its notification capabilities, now referred to as Alerts.
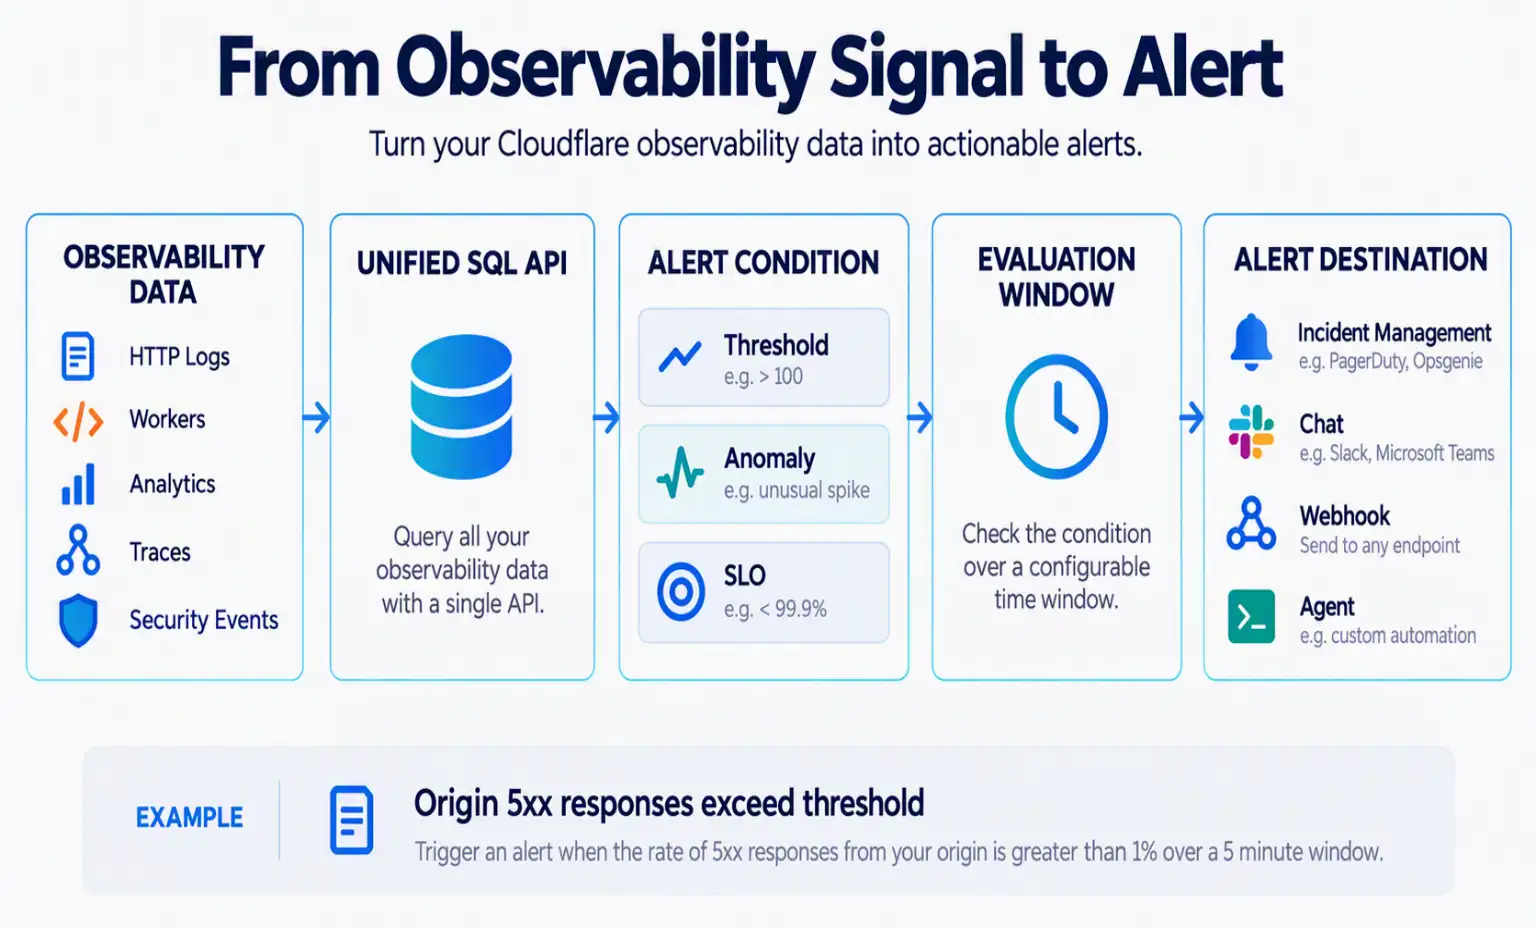
Custom alerts can be configured on data supported by the unified SQL API, including:
HTTP request logs
Workers events
Workers Analytics Engine datasets
Analytics datasets
Traces
Security events
Users can select a dataset from the dashboard or define alert conditions using custom SQL.
Cloudflare says alert conditions can use:
Thresholds
Anomalies
SLOs
Users can also define an evaluation window and select where the resulting alert should be delivered.
Examples provided by Cloudflare include detecting elevated origin 5xx responses, repeated Container failures, increased Worker errors after a deployment, or trace latency exceeding an expected limit.
Alerts can be sent to incident management systems, chat platforms and webhooks.
Cloudflare says webhooks are now available on all plans, allowing alerts to be routed to custom services or an agent for investigation.
6. Domain analytics now includes 30 days of retention
Cloudflare is bringing traffic, performance, security, cache, origin and DNS information together in its domain analytics experience.
The company says the goal is to make relationships between these signals easier to understand.
For example, if latency increases, users can examine whether the change is associated with a particular Cloudflare data center, hostname or origin.
Another update is 30 days of domain analytics on every plan.
Cloudflare says the additional history can help users investigate incidents after they occur, compare current behavior with previous weeks and distinguish isolated spikes from longer-running trends.
7. Custom dashboards bring multiple signals together
Cloudflare is also introducing Custom Dashboards.
Prebuilt dashboards can cover common scenarios, but applications may depend on several Cloudflare services at the same time.
Custom Dashboards allow users to combine:
Cloudflare analytics
Workers platform logs
Workers traces
Security events
Cloudflare says teams can monitor signals such as request volume, errors, latency, storage and blocked traffic in a shared view.
The idea is to reduce the need to reconstruct the same queries every time an investigation begins.
8. Logpush becomes available on self-serve plans
Cloudflare is expanding Logpush beyond Enterprise customers.
The company says Logpush is now available on all self-serve plans, allowing customers to export Cloudflare logs to destinations and tools they already use.
Cloudflare is also making Logpush Transformers generally available.
Transformers allow users to apply SQL transformations before delivery, including filtering, redaction, enrichment and reshaping of output.
The company says this can be done without operating a separate ETL pipeline.
Cloudflare is introducing usage-based pricing for Logpush and Transformers.
Export usage | Included each month | Additional usage |
|---|---|---|
Exports to Cloudflare destinations | 25 GB | $0.03 per GB |
Exports to external destinations | 25 GB | $0.10 per GB |
Logpush Transformers | 1 GB | $0.04 per GB |
The pricing applies to usage beyond the included monthly allowance.
What's coming next
Cloudflare also outlined several upcoming observability developments.
Longer data retention
Cloudflare says customers will eventually be able to retain logging and tracing data for up to one year.
The company says this is intended to support investigations into recurring issues, historical comparisons and longer-term trends.
OpenTelemetry API support in Workers
Cloudflare says it will continue expanding OpenTelemetry APIs in Workers, including capabilities for adding attributes to existing spans and working with trace context.
Metrics export through OpenTelemetry
Cloudflare also plans to enable Cloudflare metrics to be sent to OpenTelemetry-compatible destinations for analysis alongside telemetry from other parts of an organization's stack.
New observability pricing
The unified pricing model for observability data is scheduled to take effect on December 1, 2026.
Cloudflare says customers will be notified before the change takes effect.
What the changes mean for observability workflows
Source facts: Cloudflare is bringing several previously separate observability capabilities into a shared platform covering logs, traces, analytics, SQL querying, alerts, dashboards and exports.
Analysis: The announcement highlights a broader industry shift toward making observability data accessible through common interfaces rather than requiring teams to understand separate tools for each infrastructure component.
The unified SQL API is particularly relevant to this direction because Cloudflare is positioning the same query interface for both people and AI agents.
The addition of an Observability MCP server also connects telemetry investigation with agent-based workflows. Cloudflare says agents can use observability data to investigate issues and verify fixes.
That does not mean every incident can be automatically resolved. The practical value will depend on the quality of available telemetry, query access, alert conditions and the workflows organizations build around the data.
Cloudflare's use of OpenTelemetry, W3C Trace Context and SQL also points toward greater interoperability between Cloudflare telemetry and broader observability environments.
Pricing and availability at a glance
Capability | Status |
|---|---|
Unified Logs home | Available |
Cloudflare Traces | Open beta |
Unified SQL API | Beta |
Custom Alerts | Beta |
Domain analytics | 30 days retention on every plan |
Custom Dashboards | Available |
Logpush | Available on all self-serve plans |
Logpush Transformers | Generally available |
Unified logs and traces pricing | Starts December 1, 2026 |
One-year logs/traces retention | Coming soon |
OpenTelemetry API expansion in Workers | Coming |
Metrics export through OpenTelemetry | Coming |
Conclusion
Cloudflare's October 2026 announcement brings eight observability updates under a more unified platform model.
The changes span the full workflow from collecting and investigating telemetry to querying data, tracing requests, creating alerts, building dashboards and exporting logs.
The company is also extending observability access to AI agents through its unified SQL API and Observability MCP server, while adding standards-based integrations through OpenTelemetry and W3C Trace Context.
For Cloudflare customers, the announcement also introduces a significant pricing change beginning December 1, 2026, based on the volume of observability data ingested and stored.
The broader direction is clear from the announcement: Cloudflare is treating observability less as a collection of individual product tools and more as a shared platform for understanding application and infrastructure behavior.
Source: Cloudflare Blog
About the Author