
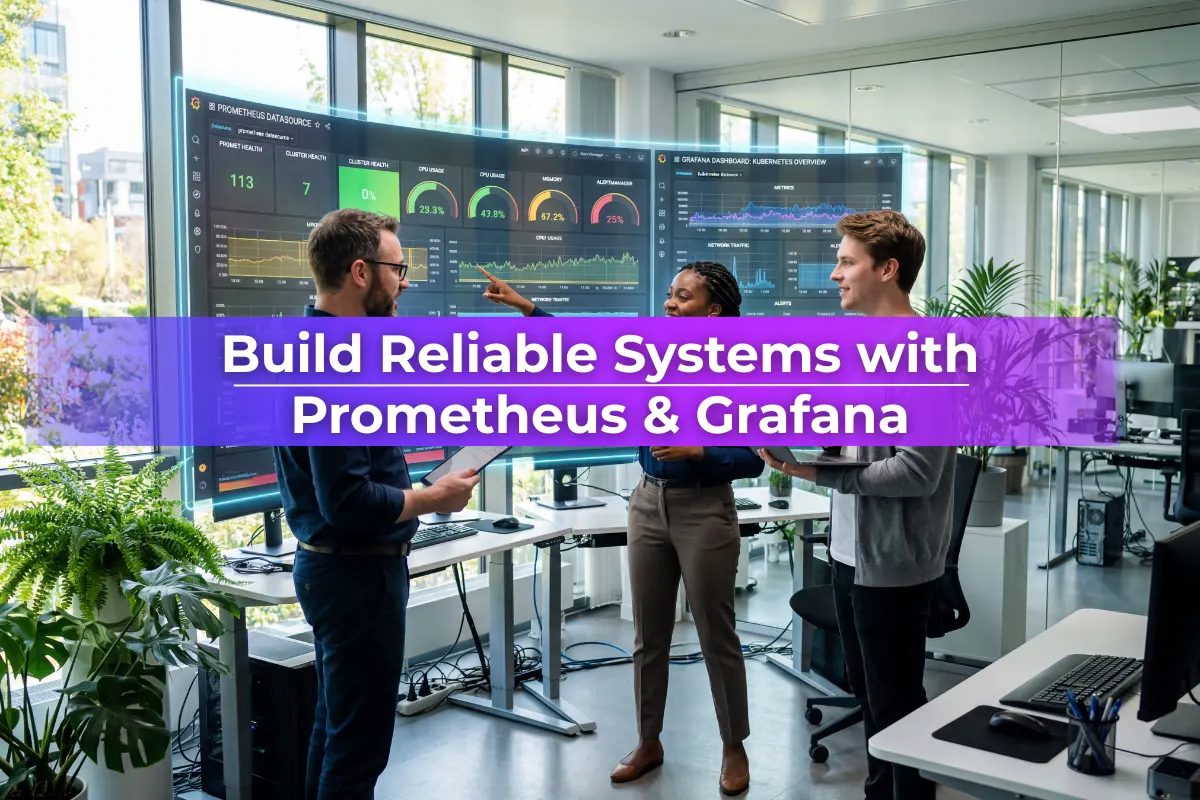
Course Overview
Observability is essential for operating reliable cloud-native applications and infrastructure. This coaching programme develops practical monitoring and observability skills using Prometheus and Grafana.
The programme aligns with the knowledge domains of the Prometheus Certified Associate (PCA) certification and introduces the core concepts required for metrics monitoring, alerting, and observability-driven operations.
Across two intensive days, participants practise collecting metrics, writing queries using PromQL, configuring alerts, and building dashboards used by modern DevOps and site reliability engineering teams.
Learners gain the ability to monitor applications and infrastructure, detect incidents early, and analyse operational performance using industry-standard observability tools.
Hands-On Learning
Participants practise configuring Prometheus monitoring pipelines, writing PromQL queries, and building operational dashboards in Grafana.
Mentor-Led Sessions
Industry mentors guide learners through monitoring architectures used in cloud-native and Kubernetes environments.
Career-Ready Skills
Develop practical observability and monitoring skills used by DevOps, cloud engineering, and site reliability engineering teams.
Learning Outcomes
Explain observability concepts used in modern infrastructure
Deploy monitoring systems using Prometheus
Query and analyse metrics using PromQL
Configure alerting rules and notifications
Build operational dashboards using Grafana
Monitor applications and infrastructure performance
Prerequisites
Basic knowledge of Linux or cloud infrastructure
Familiarity with DevOps or system administration concepts
Basic understanding of containers or Kubernetes recommended
Detailed Syllabus
Organized by professional domains with comprehensive coverage
Topics Covered:
- •Monitoring vs observability
- •Metrics, logs, and traces
- •Observability in cloud-native systems
- •Reliability monitoring practices
Skills You'll Gain
Master these in-demand skills through hands-on practice
Career Progression
A clear view of the roles this programme supports, what typically comes next, and where learners progress over time
Ways to Learn
Choose the learning format that works best for you and your team
Live Online
Instructor-Led Training
Join live instructor-led sessions from anywhere. Interactive, engaging, and flexible.
- Live instructor interaction (real-time)
- Trainer-led walkthroughs and real examples
- Guided resources and session notes provided
- Structured Q&A and practical discussion
Price per person
Group enrolments and early planning options available.
All prices are exclusive of VAT where applicable. Group enrolments and custom packages available on request.
Prefer a Faster, Personalised Route into IT?
Not everyone learns best in a group. If you want focused guidance, faster clarity, and confidence you can use on the job, our 1-to-1 Fast-Track Training gives you private, mentor-led support tailored to your experience and goals.
"Many learners choose 1-to-1 when they want understanding, not memorisation."
Exam & Certification Information
Everything you need to know about the certification exams
Credential
Certificate of Completion
On successful completion of Prometheus & Grafana Training, learners receive an Xcademia Certificate of Completion. This standalone certificate is issued directly by Xcademia and is aligned with globally recognised frameworks and best practices.
Frequently Asked Questions
Everything you need to know about this course
DevOps engineers, cloud engineers, and operations professionals responsible for monitoring infrastructure and applications.
Ready to Start Your Learning Journey?
Take the next step in your professional development